An alternative method of proppant forecasting, using a direct correlation between gas production and proppant use can reduce many of the uncertainties associated with traditional forecast techniques.
With the recent additions of LNG Canada Phase 2 and the Ksi Lisims LNG project to the first tranches of the Federal government’s Major Projects list, industry observers can be forgiven for having a rosier long-term outlook for Western Canadian natural gas development. Along with Ksi Lisims, two other LNG facilities, Woodfibre and Cedar, are currently being constructed, and LNG Canada Phase 1 began operations earlier this year. These projects alone, at their currently stated capacities, have the potential to increase Canadian natural gas demand by more than 6.5 bcf/d by 2032. This will require producers to upscale drilling and completion operations accordingly.
A growing concern for operators is sourcing proppant for fraccing operations, and forecasting future requirements. Like predicting gas demand itself, a mind-numbing array of variables can come into play for proppant forecasting, often wellbore-related (spud counts, lateral length, and frac intensity, for a few examples). But some of these variables can be eliminated, in a matter of speaking, if proppant use can be tied directly to production. Take the Montney as an example.
Figure 1 illustrates the median amount of proppant required to bring one bcf of “new” Montney gas on stream every year from 2010 to 2024, with a forecast out to 2032 using the historical trend. The calculation is done on a per-well basis, by dividing the tonnage of proppant used for a frac by the same well’s initial one year cumulative gas production (in bcf). The annual increase in this metric is striking, with the median nearly quintupling between 2010 and 2024. To convert the “proppant per new bcf” value to the rate-related “proppant per new bcf/d”, it would be multiplied by 365, as this is what would be required to maintain one bcf of new production over an entire year. This is the direct link between proppant use and gas production.
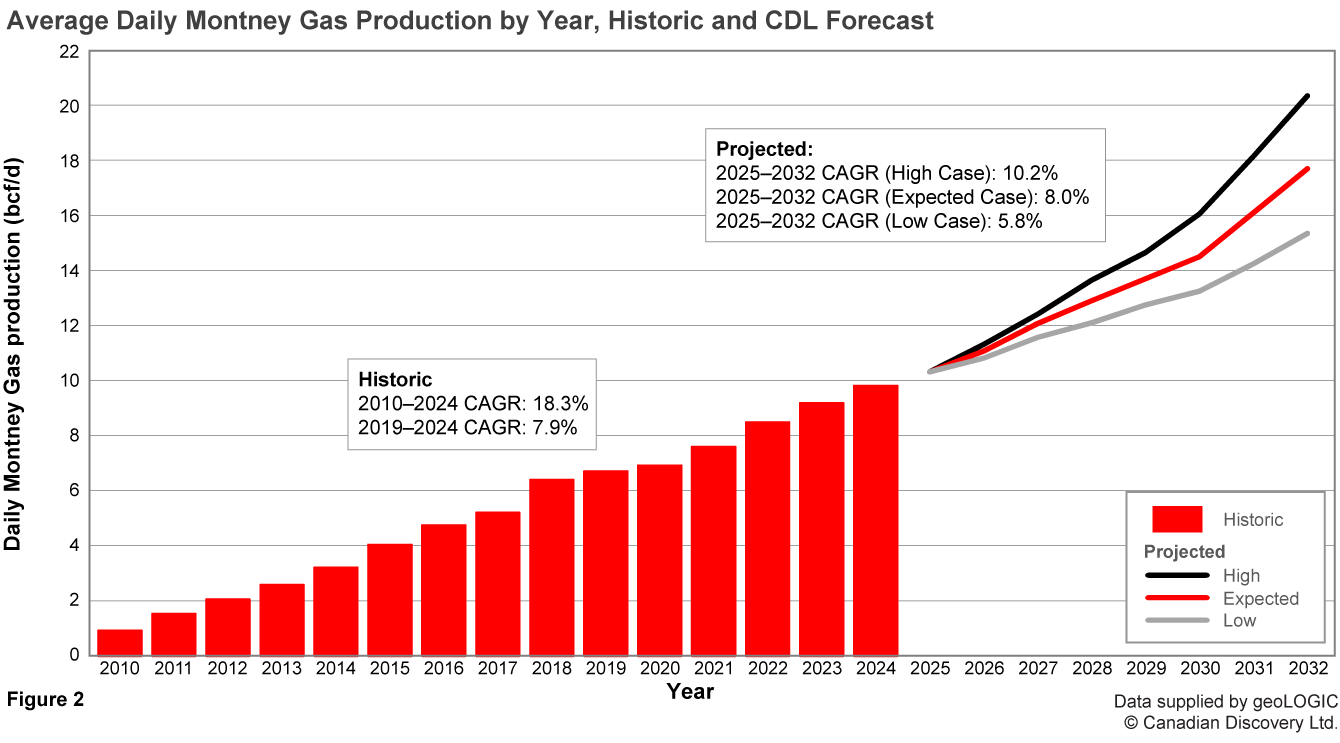
Figure 2 presents CDL’s high, low, and “expected” forecasts for annual Montney gas production rates from 2025 to 2032, using several independent sources. Montney gas will likely be the primary feedstock for LNG operations, and all three forecasts assume that the four aforementioned LNG projects (including Phase II of LNG Canada) will become operational given their advanced state of investment and approval. However, operational timing varies with each forecast, with expected and low case forecasts using startup dates later than those of the high case. The low case assumes Ksi Lisims will not be operational until after 2032, so it is not included in that particular forecast. Other variables include the addition of increased demand for NG-based power generation for proposed AI data centres, and capacity for LNG projects that are at earlier stages of planning and development, such as the Tilbury Phase 2 expansion in Richmond, BC.
It’s important to remember that the forecasted annual increases in gas production are not the only “new” bcfs to be counted. Declines from legacy production also need to be considered. With the Montney running at roughly 28% gas decline annually overall, it is a considerable volume to make up (with new fracs and wells) before additional demand can be met each successive year.
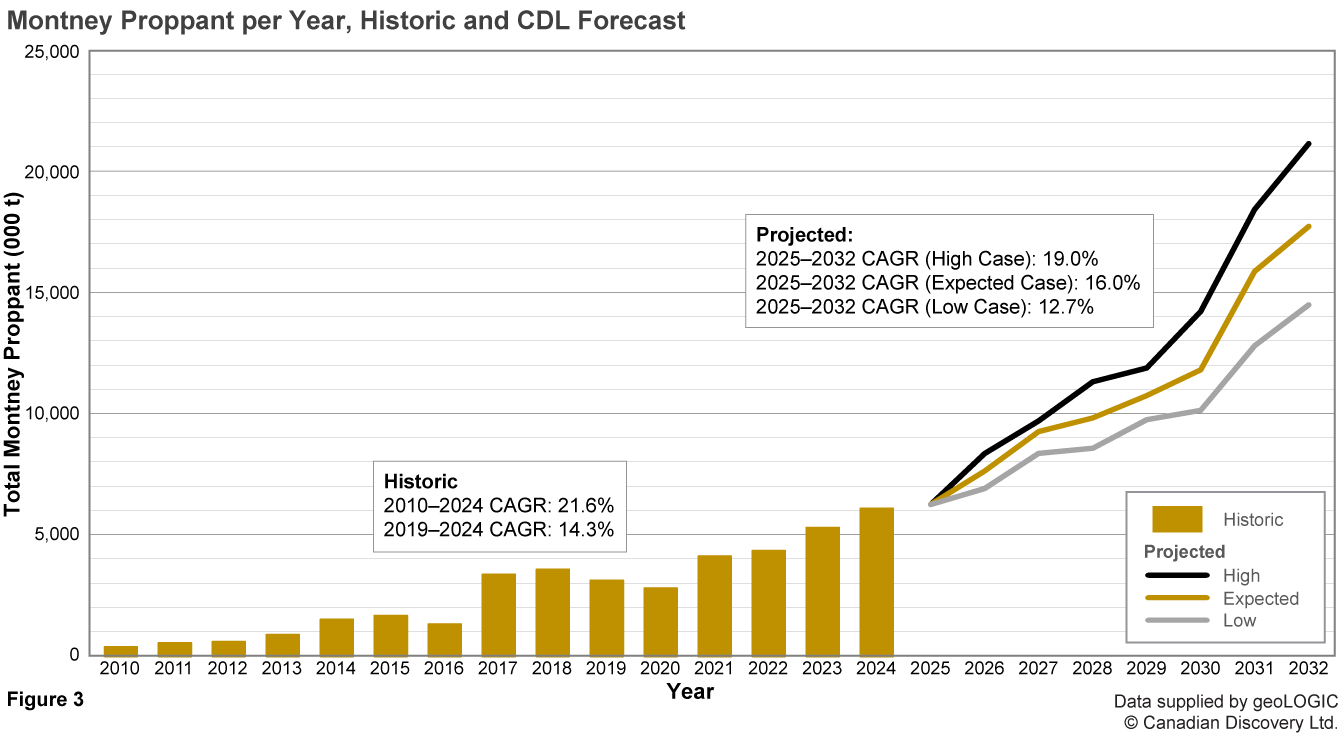
With forecasts of new Montney production and proppant per unit of new production at the ready, estimates of the total proppant tonnage required per year can be calculated. Figure 3 shows historical annual Montney proppant use from 2010 to 2024, and the three forecast cases from 2025 to 2032. In order to determine the most accurate forecast possible, all aforementioned metrics were calculated separately for Montney production in BC and AB to account for the production split between the two provinces (currently 68/32 between BC/AB), and then regrouped to obtain a forecast for the Montney as a whole.
At first glance, the growth in proppant use may be surprising, even considering the new LNG demand; the Expected case results in a near-tripling of Montney proppant tonnage between 2025 and 2032, with a total annual demand of over 17.7 Mt at the end of the projection period. However, the compound annual growth rate (CAGR) of the Expected case over the forecast period, at 16.0%, is only slightly higher than the historic CAGR between 2019 and 2024 (14.3%). The longer term historic CAGR, between 2005 and 2024, is 21.6%, higher than that of even the High case projection (19.0%).
Would it be more appropriate to use proppant per BOE (instead of a pure gas unit) as the relation factor? If all produced fluid phases are included, we would have a lower tonnage per BOE due to the high liquids content of many Montney wells. However, only gas can meet LNG demand, so it should remain the main factor in proppant forecasting. Since these high liquids wells typically produce less gas than their dry gas counterparts, they have a higher proppant/bcf value. The high value of the liquid components, however, continue to provide strong economics for these liquids-rich wells.
The Montney has typically accounted for approximately 2/3 of Western Canadian proppant demand in recent years. Similar projections for other zones that aren’t as closely as tied to LNG demand, including the Duvernay and Spirit River indicate that annual proppant use across the entire WCSB could be pushing past 25 Mt by the first few years of the next decade. This will make securing frac sand sources a growing issue for Canada’s energy industry, given that this demand forecast is potentially 3x the current proppant market in Canada. Additional details of this Montney proppant forecast, along with those for other key producing zones, are discussed in an upcoming CDL Digest article.
Want to dive deeper? Learn more about the upcoming CDL Digest article here, and sign up to get your complimentary copy as soon as it’s released—delivered directly to your inbox.
References
About the Author(s)
Chris Podetz
Senior Geologist
Chris has been a geologist at CDL since 2017 working as an Exploration Analyst. He has written and researched over 100 articles for the CDL Digest on a wide variety of plays and areas within the WCSB, with a current focus on the Montney, Clearwater, and Cardium. Other industry interests include lithium development potential in BC, Alberta, and Saskatchewan. Chris' previous experience includes stints as a petroleum geologist for Mapan Energy and Encana, geomechanical consulting with Advanced Geotechnology (AGI), gold exploration and resource delineation near Rankin Inlet, NU and a term as a shipper/receiver for Co-op Home Health Care in the mid-2010s. He obtained a Bachelor of Applied Science degree in Geological Engineering from Queen's University in 1997.